Invoking the Extension API
Invoke Method
There are many classes under the EasyEDA Pro Extension API module, all Classes, Enumerations, Interfaces, Type Aliases are registered under the EDA base class by default and have been instantiated as eda object exists in the root scope of every extension runtime, and you can access it directly through the eda object.
All extension's runtime get a separate eda object, which is not shared with other extensions. You can output this object on the console in Debug Mode within an extension (or in Standalone Script) using the following code:
console.log('[DEBUG] eda:', eda);Standard extension API calls require the splice eda + class instance object name + method name / variable name. The object names corresponding to classes instantiated in the system are in the form of the first three letters of the underscore in lowercase, for example:
| Class Name | Class Instance Object Name |
|---|---|
| SYS_I18n | sys_I18n |
| SYS_ToastMessage | sys_ToastMessage |
The following example calls the text method under the SYS_I18n class and the showMessage method under the SYS_ToastMessage class:
// Note that the `sys` in `sys_I18n` is lowercase because we need to use the object name when calling the
eda.sys_ToastMessage.showMessage(eda.sys_I18n.text('Done'), ESYS_ToastMessageType.INFO);

const t = eda.sys_I18n.text; // Assign `eda.sys_I18n.text` method to `t`
eda.sys_ToastMessage.showMessage(t('Done'), ESYS_ToastMessageType.INFO); // This will give you exactly the same result as line 2Commissioning Methods
Entering Debug Mode
You can add the cll=debug parameter within the URL of the EasyEDA Pro editor to enter debug mode:
- https://pro.easyeda.com/editor
+ https://pro.easyeda.com/editor?cll=debugThen press F12 three times in quick succession to open the developer tools. Switch to the Console tab to output debugging information.
TIP
If you are using the desktop client, you can press F12 three times in quick succession to open the developer tools, then enter the following in the console:
window.location.href = 'https://client/editor?cll=debug';Then you can enter debug mode.
Debugging with Standalone Scripting
When using the extension API interface, you need to compile the changes first and upload the compiled result to EasyEDA before you can see the result. If you have some logic that you want to split out for debugging, you can try using the standalone script feature.
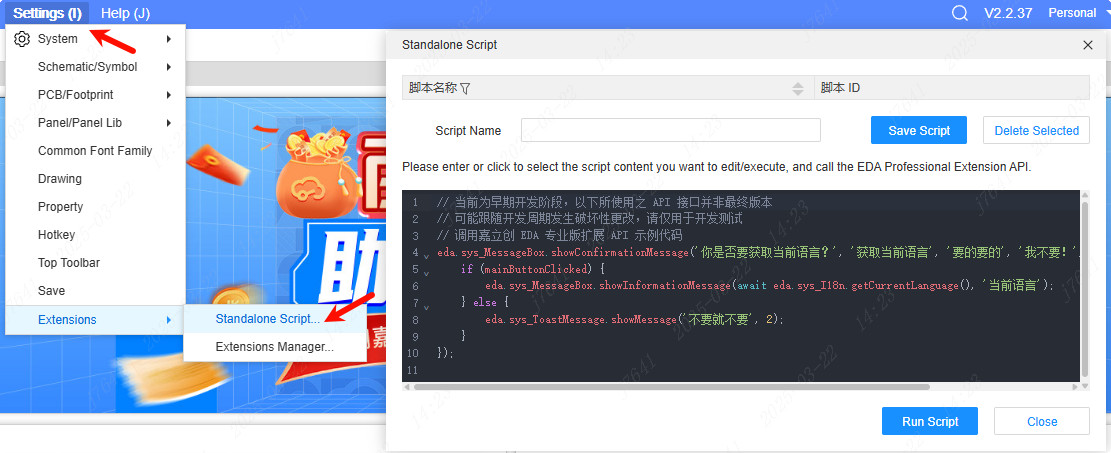
EasyEDA Pro V2
Entry: Top Menu -> Settings -> Extensions -> Standalone Script
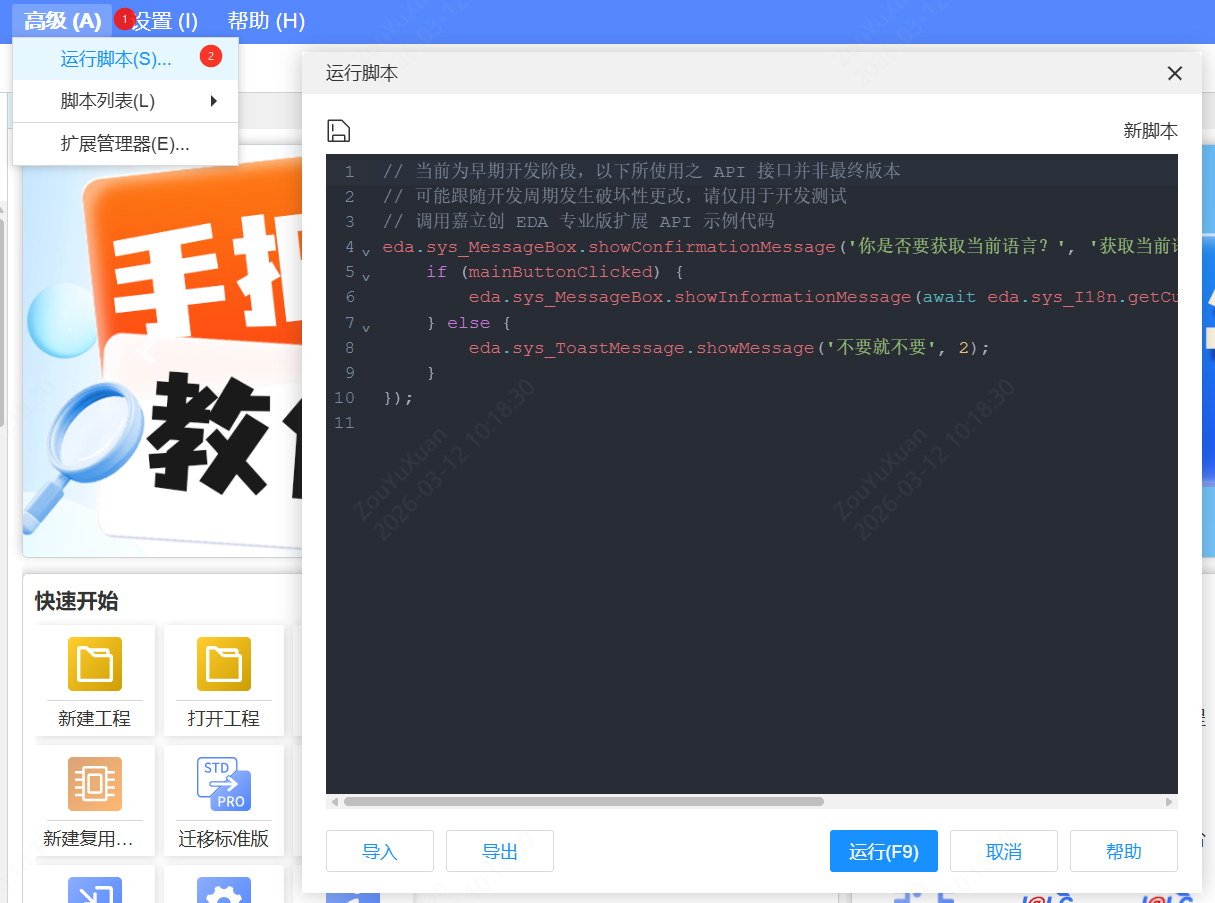
EasyEDA Pro V3
Entry: Top Menu -> Advanced -> Run Script
You can use Script Manager to save standalone scripts and run them quickly:
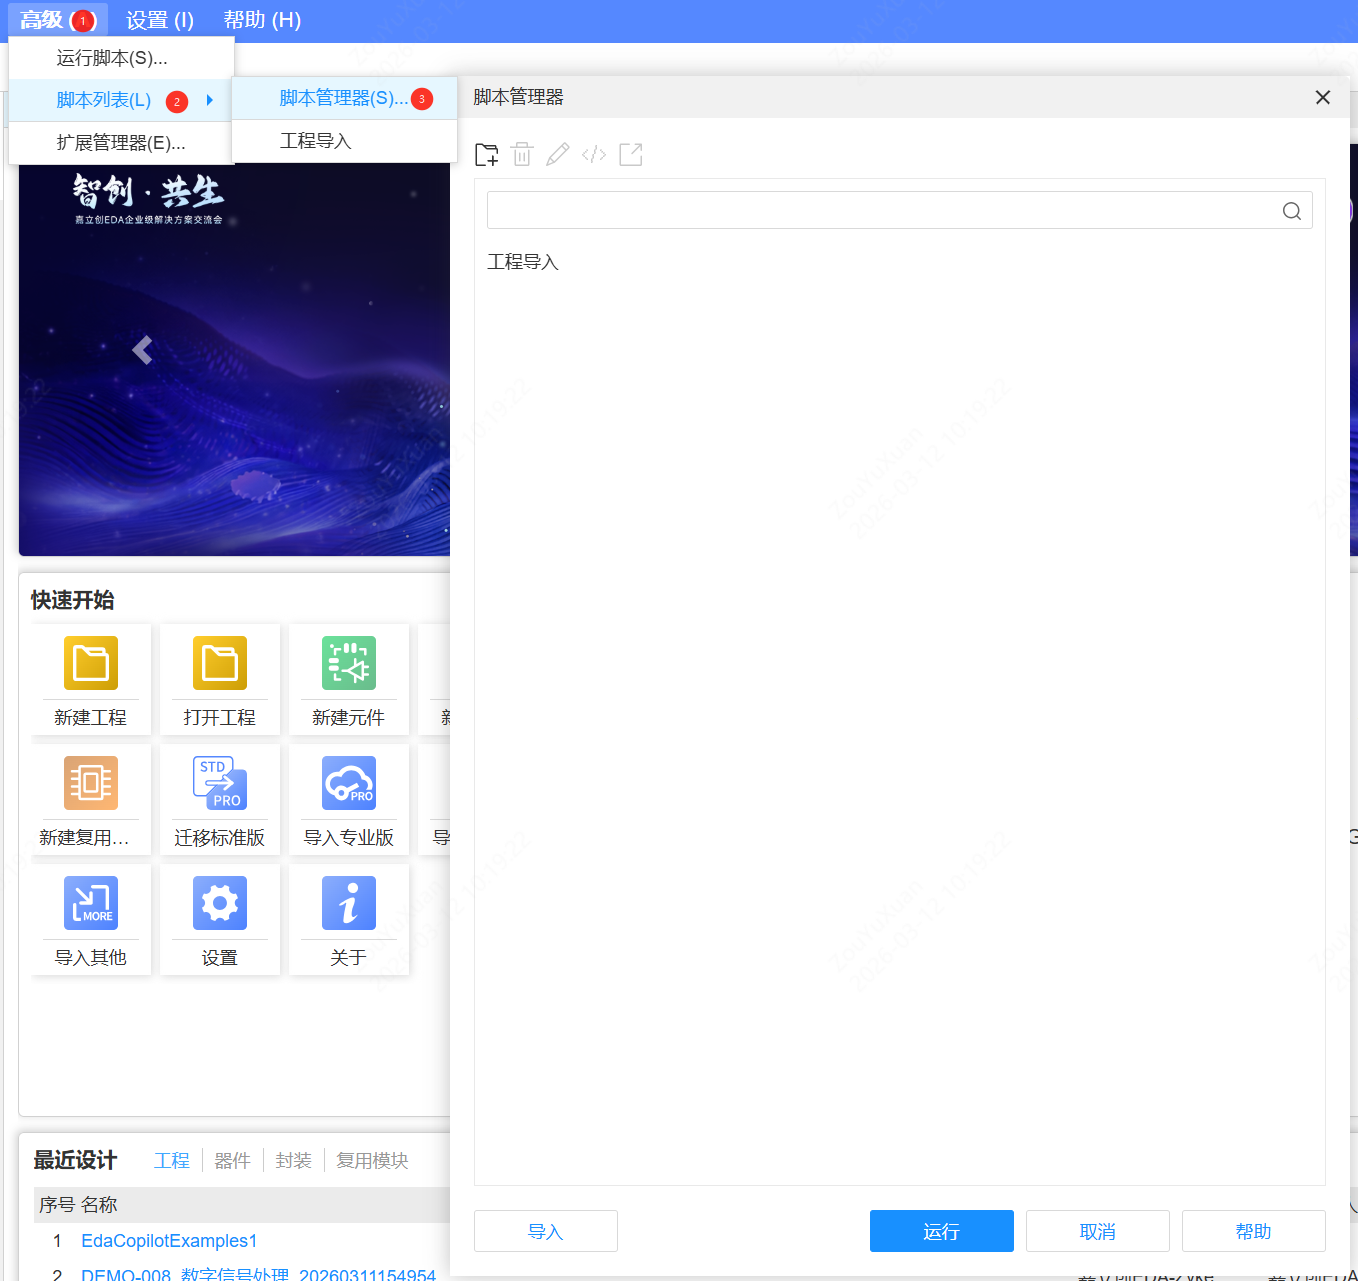
Standalone scripts get a unique, throw-away eda object each time they run, so you don't have to worry about contaminating the runtime environment with the results of previous runs. Note, however, that some of the extension API interfaces, such as SYS_IFrame, cannot be called from within a standalone script because they use features from extension packages or external interactions.
The standalone script's save feature stores data in the browser's LocalStorage or IndexedDB, which is generally sustainable locally, but please note that this is always insecure, so please backup your own standalone scripts.